
What to be able to hand over
A campaign report should distinguish delivery, response and value. Agree what counts as a lead or conversion before comparing channels with different audience sizes.
- A channel performance review
- Use consistent dates and definitions for spend, clicks, leads and recorded conversions.
- A reproducible rate calculation
- Show the denominator and guard against empty data. A percentage without its sample size can hide a weak comparison.
- An evidence-based recommendation
- Explain the observed result, attribution limits and the next experiment that could test the explanation.
Build beyond this course
Research methods, statistics, channel tools and measurement design extend beyond this course. A spreadsheet comparison alone does not establish that a campaign caused an outcome.
Occupational context: BLS: Market research analysts. The handover examples above are our practice suggestions.
Work to practise
- Calculate a campaign cost per recorded order.
- Handle a zero-order campaign explicitly.
- Combine campaigns by total spend and total orders.
All examples use original synthetic data. Source row numbers and column letters are shown so you can reproduce the formulas.
Combine three campaign reports
Calculate each cost per order and the cost per order for the entire recorded spend.
USD, clicks and recorded orders; row ratios are USD per order.
| Row | A · Campaign | B · Spend USD | C · Clicks | D · Orders |
|---|---|---|---|---|
| 2 | Search A | 240 | 120 | 12 |
| 3 | Newsletter B | 180 | 90 | 3 |
| 4 | Display C | 80 | 160 | 0 |
Worked solution and complete results
Search A USD per order · E2
=IF(D2=0,"No orders",B2/D2)Result: 20
Newsletter B USD per order · E3
=IF(D3=0,"No orders",B3/D3)Result: 60
Display C USD per order · E4
=IF(D4=0,"No orders",B4/D4)Result: No orders
Combined USD per order · E6
=SUM(B2:B4)/SUM(D2:D4)Result: 33.333333333333336
A mistake to catch
Averaging the two defined row costs gives USD 40 and drops Display spend. Replacing the zero-order error with zero makes that campaign appear free.
Correction. Show No orders on the row. Include all USD 500 of spend in the aggregate and divide by the 15 recorded orders.
Read the result
The combined cost is USD 33.33 per order when rounded for display. These invented counts omit refunds, revenue, attribution overlap and incremental effects.
Practise the skills in order
- Share of total Read the guide, then open the actual lesson.
- SUMIFS Read the guide, then open the actual lesson.
- Weighted average Read the guide, then open the actual lesson.
- Percentage growth Read the guide, then open the actual lesson.
- IFERROR Read the guide, then open the actual lesson.
- Column and line charts Read the guide, then open the actual lesson.
Practise formulas before drawing campaign conclusions. A spreadsheet ratio alone cannot demonstrate marketing lift or complete customer acquisition cost.
Practice weighted averagesPay and remote work
U.S. pay reference
- Published occupation
- Market research analysts
- Median annual wage
- USD 78,760
- Location and period
- United States · May 2025
This research/analysis occupation is the reference. Content, design, performance marketing and marketing management are different roles.
These BLS figures cover employees across work arrangements. They are not a remote-only salary, an entry-level offer or an earnings outcome from this course. Median means half earn more and half earn less.
Source: U.S. Bureau of Labor Statistics, Occupational Outlook Handbook. Reviewed . Values are U.S. dollars; no currency conversion is applied.
Read a remote posting carefully
A remote marketing role may have audience, client or time-zone requirements. Confirm whether pay refers to base salary, agency contract fees or a package with performance incentives.
Check the allowed country or state, working hours, employment or contractor status, and the currency and components of the offer. A remote role can still have location restrictions and locally set pay.
One employer example: GitLab’s candidate handbook says to check each listing’s hiring country. Its current compensation policy uses local market data and local-currency ranges. This is an illustration of employer policy, not a claim about every remote job.
Continue in a downloadable workbook
Regional sales practice
Calculate row revenue and compare regional and channel totals from pivot-ready order records.
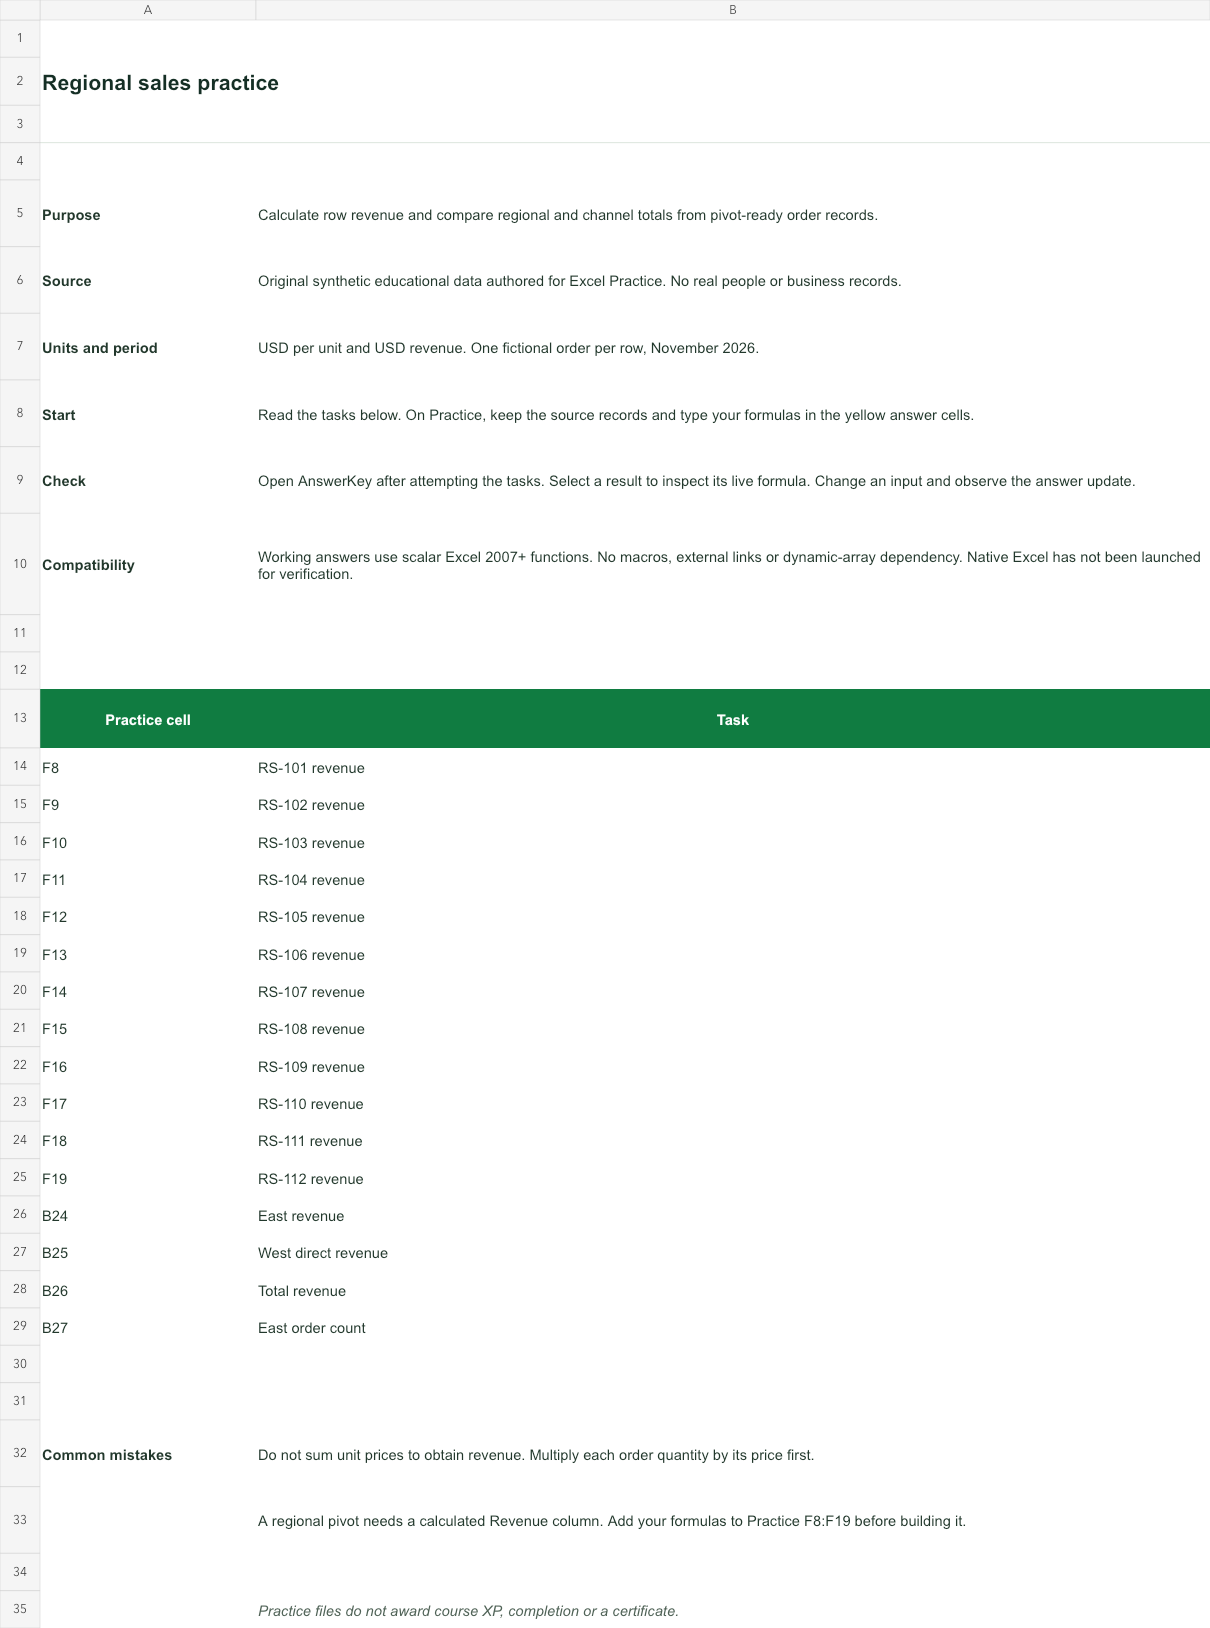
USD per unit and USD revenue. One fictional order per row, November 2026.
Bank version 2026-11-02. Includes Instructions, Practice, AnswerKey; 16 live answer formulas. All source records are invented for education.
The download is an additional practice task. Its Instructions sheet identifies the source coordinates; this page’s illustrative example may use different records.
- Working answers use scalar Excel 2007+ functions. No macros, external links or dynamic-array dependency. Native Excel has not been launched for verification.